Demo
Published Data Products (8 visualizations)

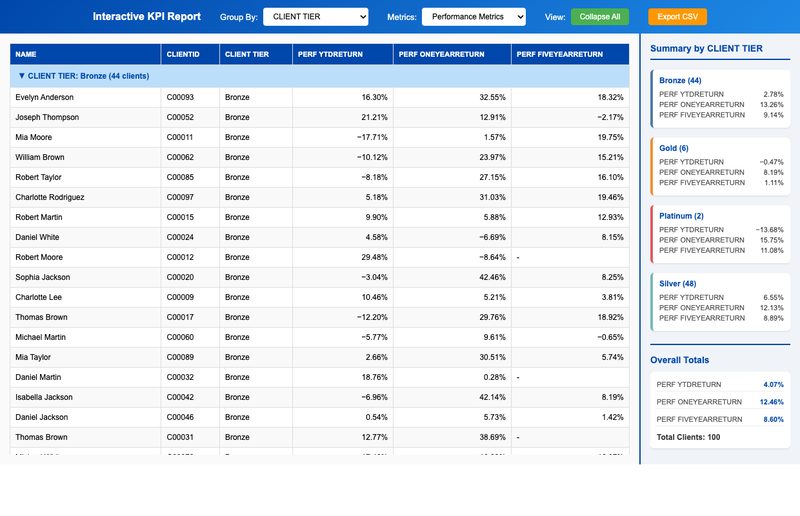
 Client Portfolio Analysis v 1
This report provides key performance metrics and KPIs with filtering options to help users analyse business data based on their specific needs. It allows decision-makers to focus on the metrics most relevant to their role or objectives.
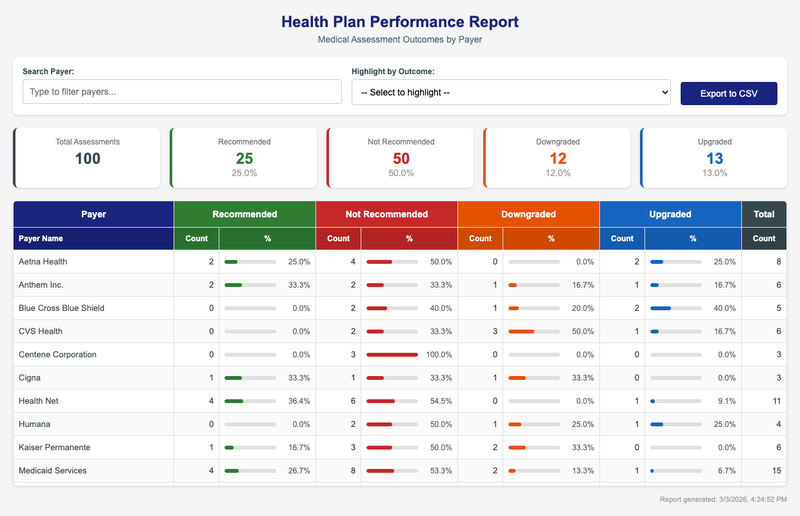
Health Plan Outcomes Pivot Table
This report shows how different health insurance plans perform on medical assessments, breaking down the percentage of cases that were recommended, not recommended, or had their status changed. Healthcare administrators and analysts can use this to compare approval patterns across payers and identify trends in assessment outcomes.
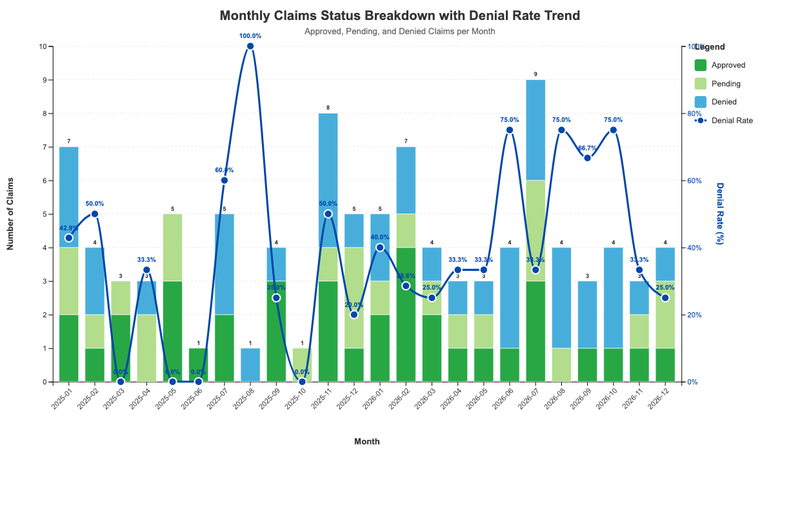
 Medicare Claims Analysis
This data product provides a monthly breakdown of claims performance, including total claims processed, payment amounts, processing times, and denial rates over time. It helps Claims leadership identify trends in operational efficiency and spot potential bottlenecks in the claims process. The information supports strategic decisions around resource allocation and process improvements.
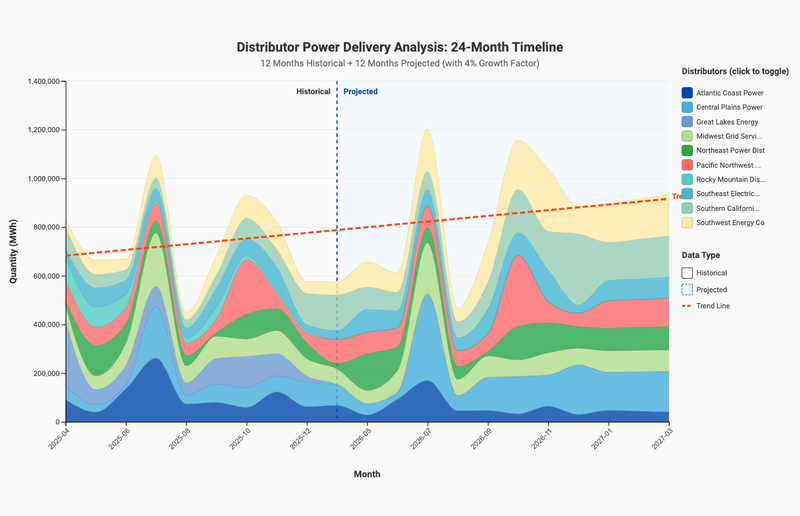
 Electrical Utility Power Distribution
This data product shows power delivery volumes for each distributor over a two-year period, combining the past 12 months of actual data with projections for the next 12 months. The forecasts account for seasonal patterns and expected demand growth, helping energy planners and distribution managers anticipate future capacity needs across their network.
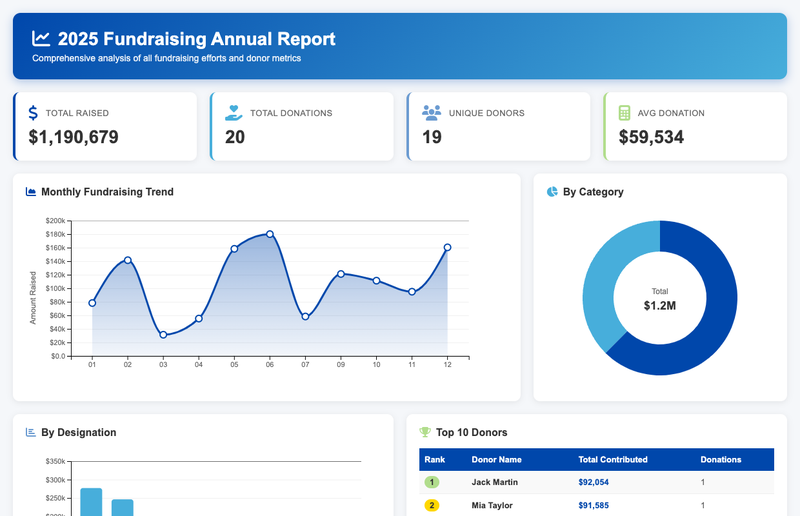
 Annual Development Report
This report provides a complete overview of fundraising performance and key metrics for 2025. It helps leadership and development teams understand donation trends, campaign effectiveness, and overall progress toward fundraising goals throughout the year.
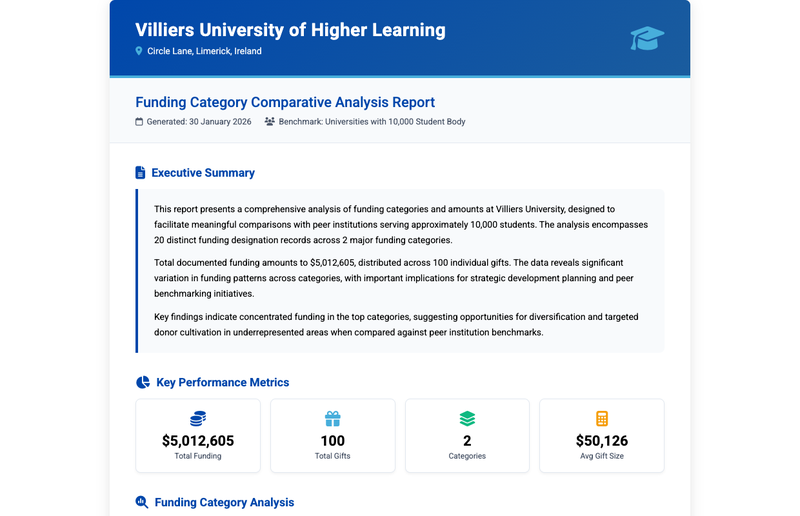
 Annual Development Narrative Report v 2
This data compares funding categories and amounts across universities with approximately 10,000 students, helping institutions benchmark their funding against similar-sized schools.
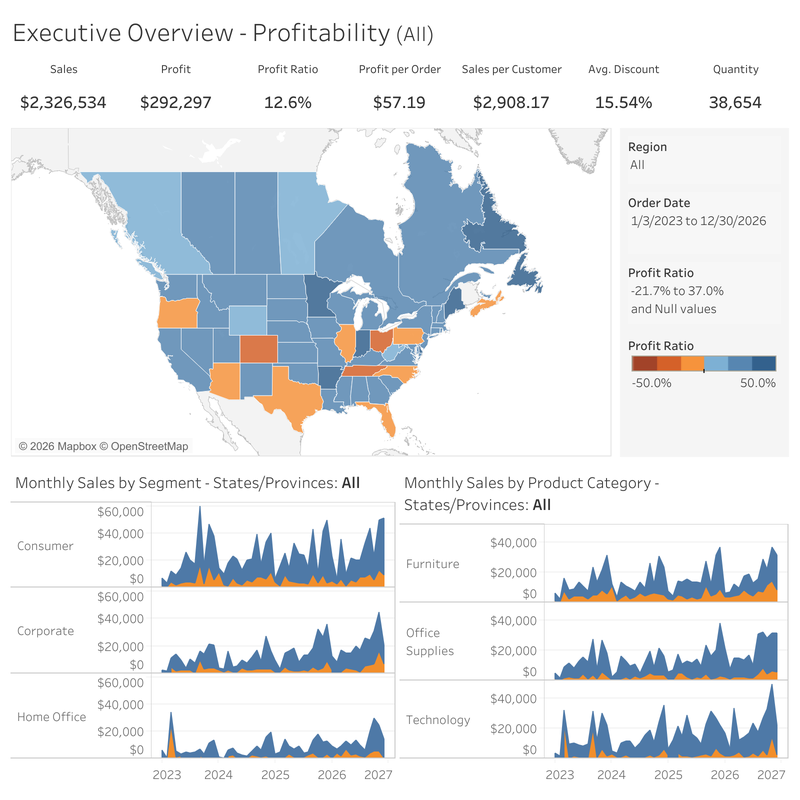
 Superstore — Overview
This dashboard provides a high-level summary of Superstore sales performance, highlighting key metrics such as revenue, profit, and order trends. It helps managers and analysts quickly assess overall business health and identify areas that may need attention.
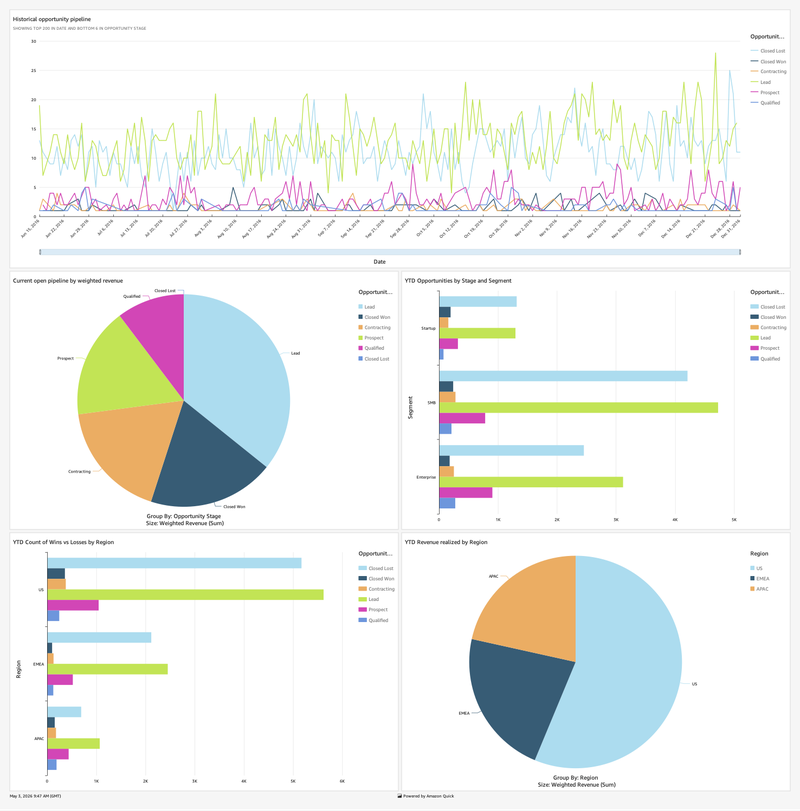
 Sales Pipeline
This data product provides an overview of the sales pipeline, showing deals at various stages from prospecting through to close. It helps sales leaders and account managers track revenue opportunities, monitor deal progress, and identify where potential sales may be stalling.